Trades of the Last Couple of Weeks: Jan 22 - Feb 9, 2024
February 11, 2024
This was my first full week of trading after returning home from my Australia trip. I'm going to do this post a little differently than the previous few just to shake things up a bit.
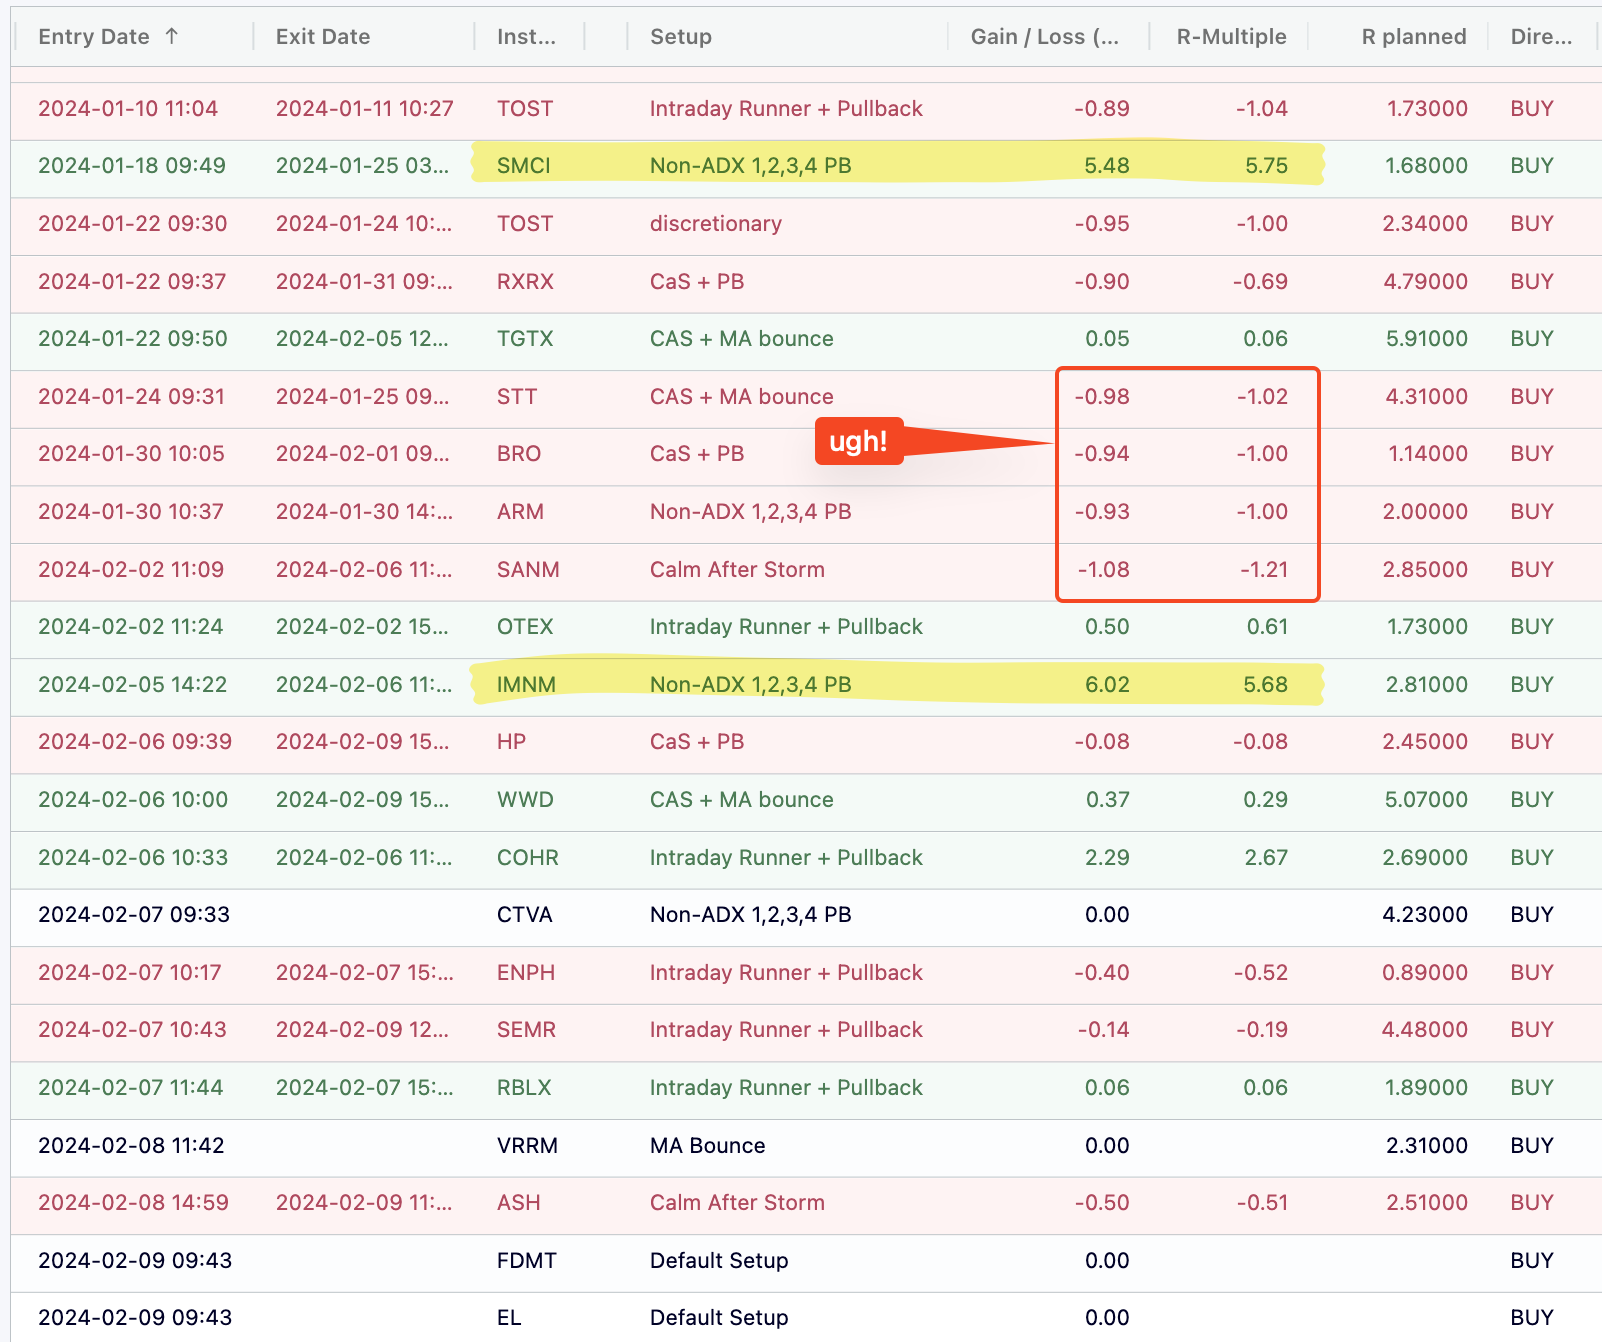
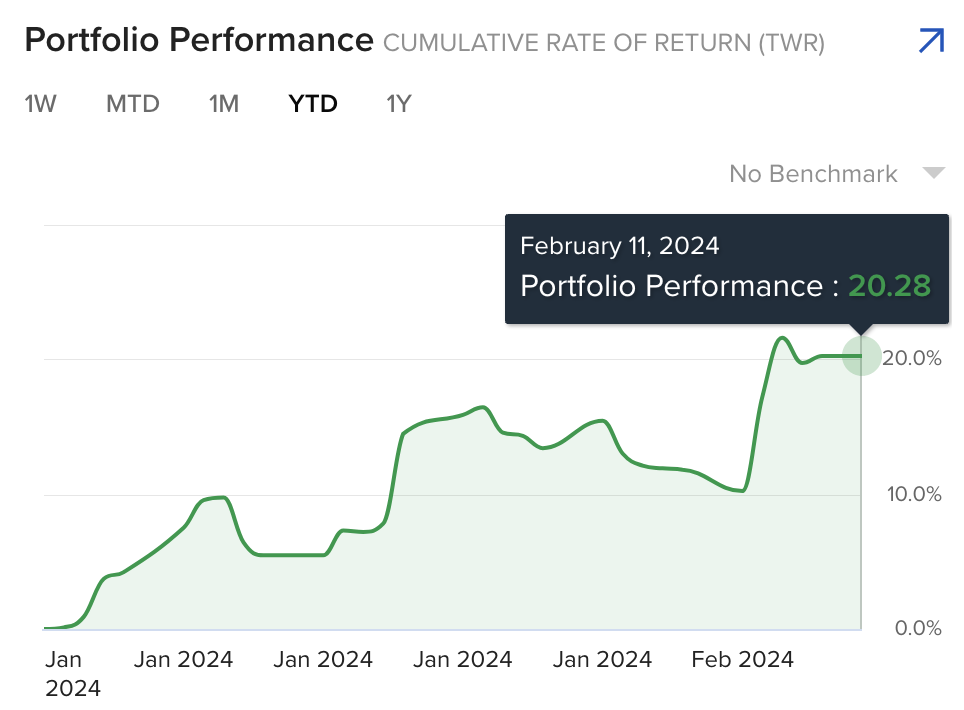
I've highlighted the two big winners, SMCI & IMNM... both of which I took based on Non-ADX 1,2,3,4 Pullback signals. The other thing I called out is the 4 in a row 1R+ losing trades. (They weren't exactly in a row... the journal is sorted by entry time but the exits weren't consecutive.) Nonetheless, that stretch wasn't fun. You can see the impact of that period between SMCI and IMNM in my equity curve -- my YTD return slid from 16.5% to 10.2% before IMNM helped it to rise above 20%:
YTD_perf_feb_9.png91.68 KB
That stretch also dragged my win rate down to 51.6%, which is worse than the 58% it was for 2023:
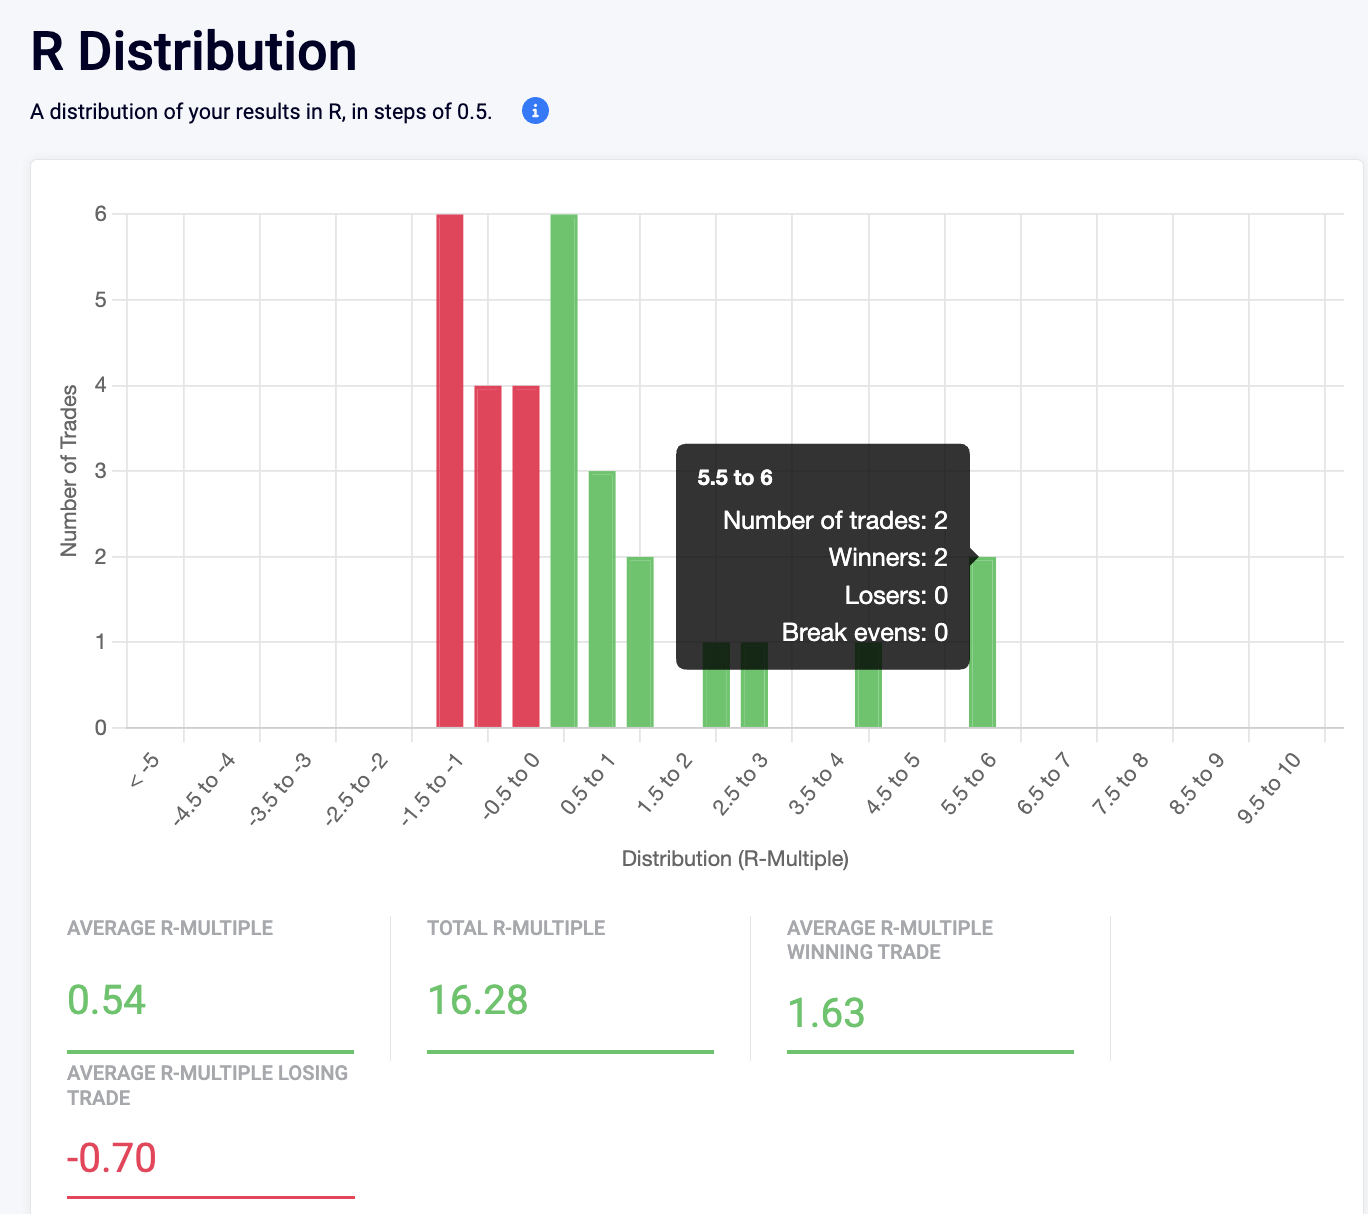
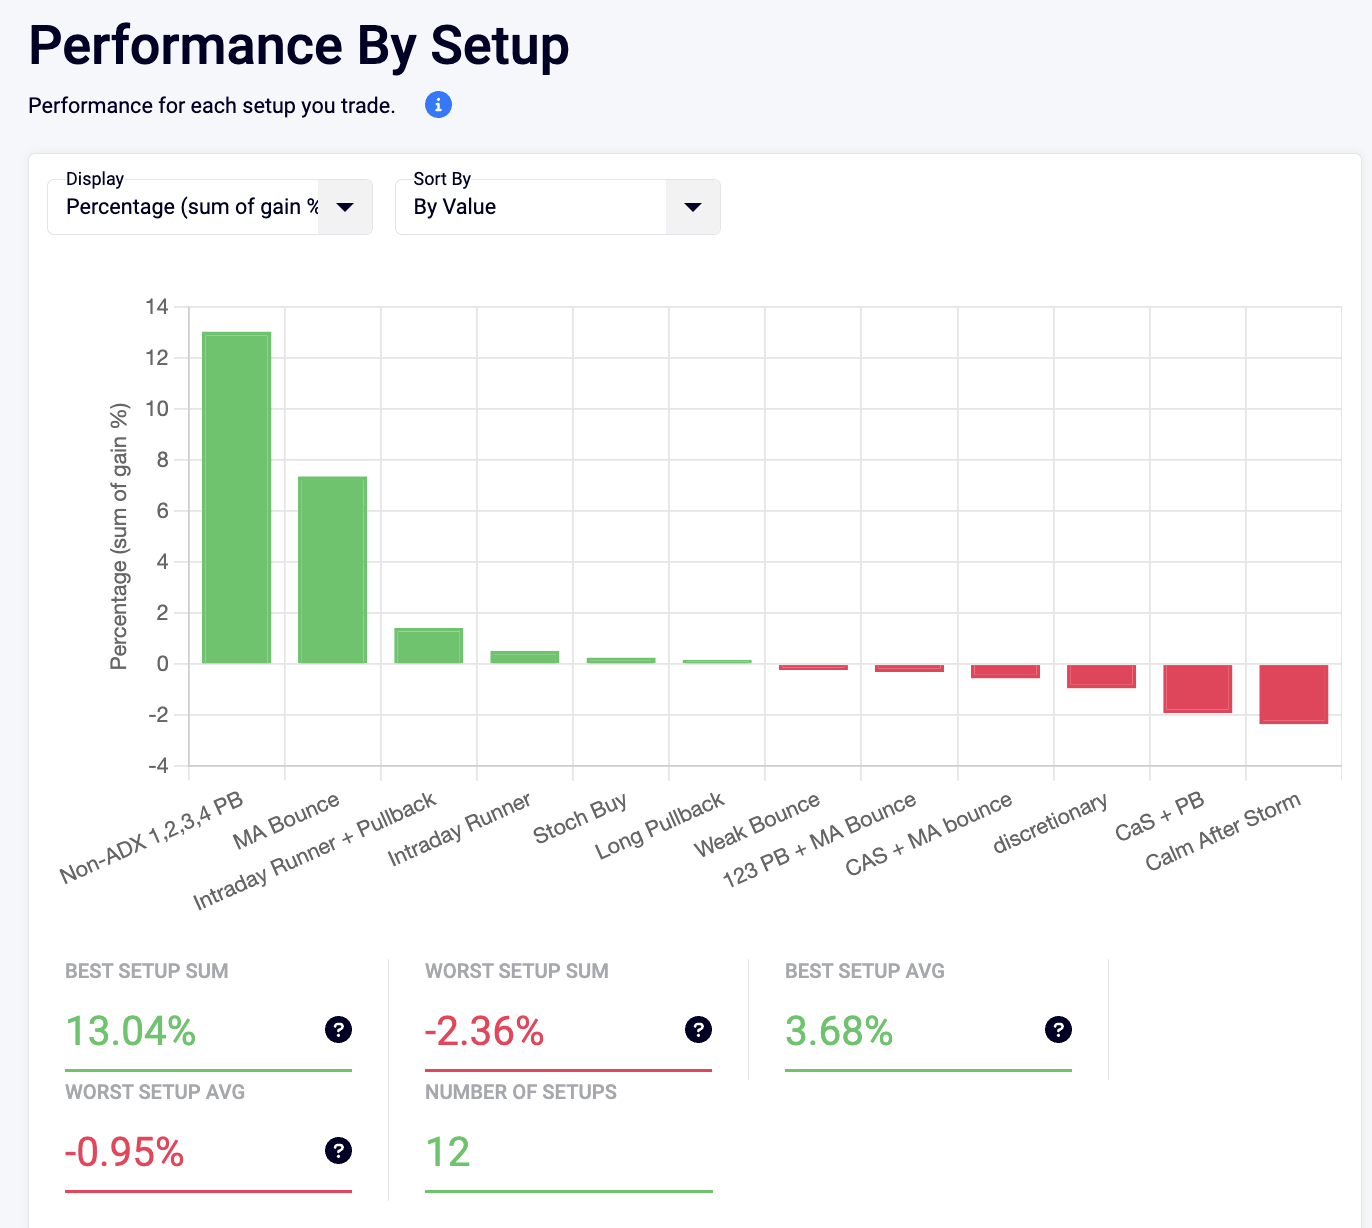
One comparison vs 2023 that I'm happy about is my R distribution. I had no trades which returned above 4.5R in 2023 and I've already got 2 in 2024. Bonus positive is that there are no trades past the -1 to -1.5 bar! Gotta keep the losses small so they're easy to recover from. R_multiple_distribution.png158.95 KB One interesting comparison vs 2023 is which setups are working for me. Non-ADX 1,2,3,4 rose to #1 & the "Best Setup Average" is now "MA Bounce". To my surprise Calm After Storm fell from first to dead last! I'm 0-for-3 so far on CAS trades but it's still early in the year and that's a tiny sample size. I can't wait to do this comparison again in a few months.
perf_by_setup.png173.13 KB
One of my takeaways from my 2023 review was :
I want to see a much larger “biggest winner”, so I need to work on holding longer.
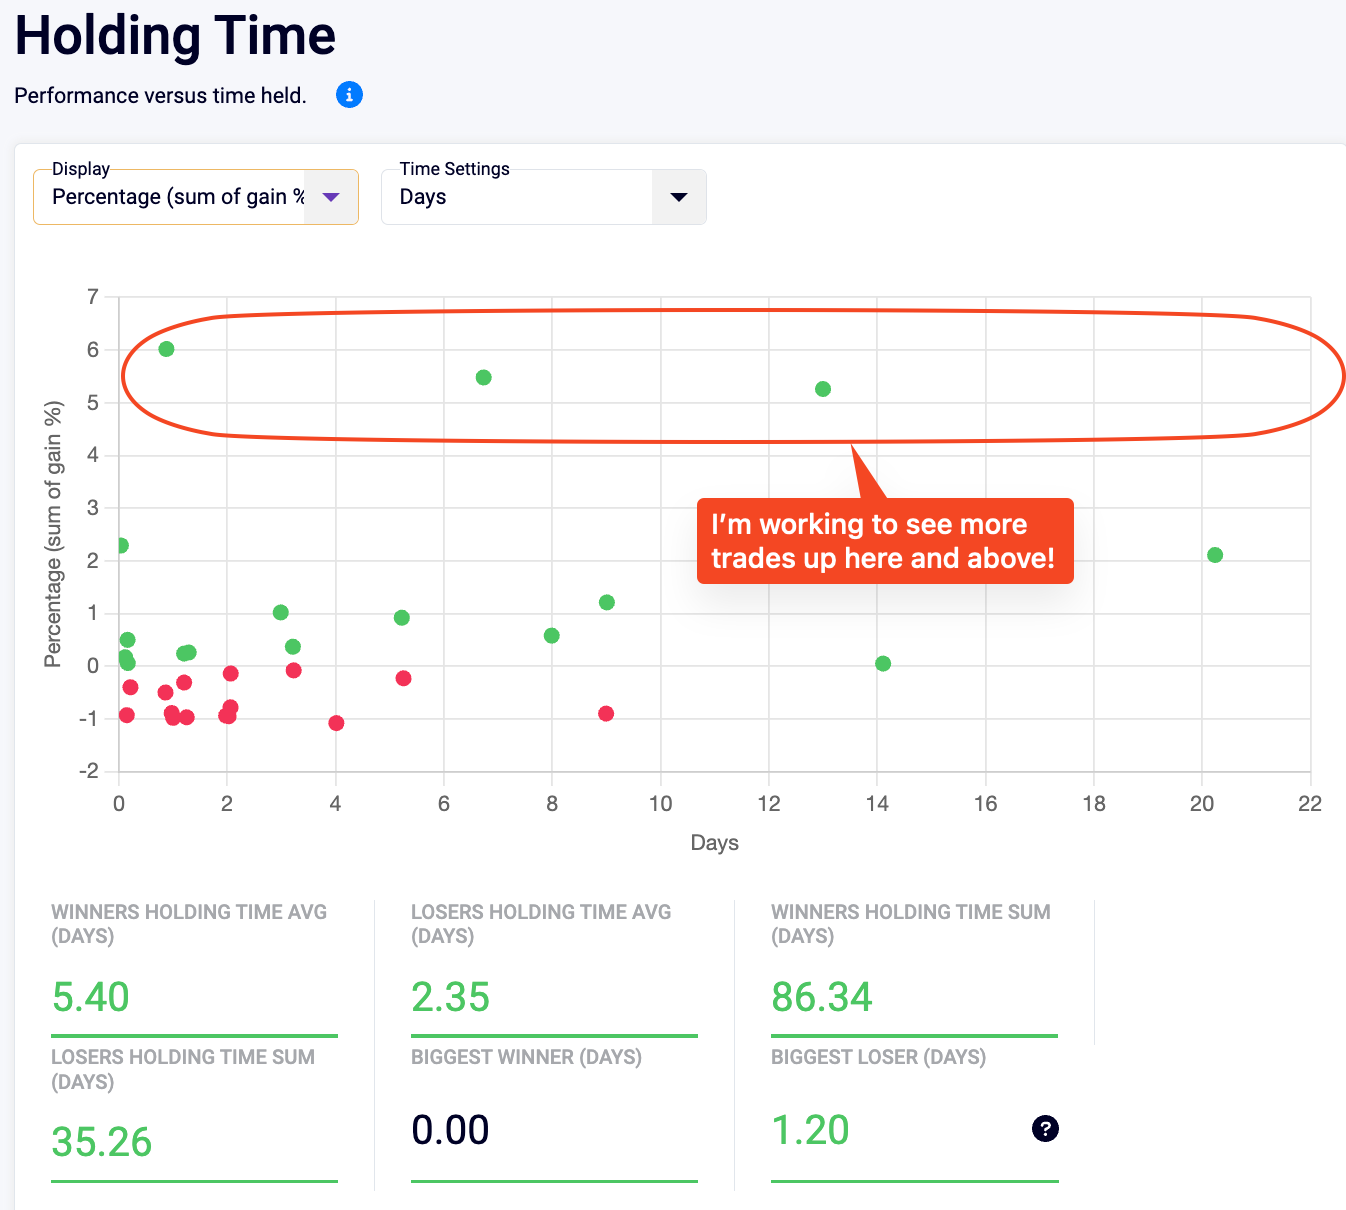
So on that note, here's 2024's holding time graph:
holding_time.png155.44 KB
So far the distribution is about the same as it was in 2023. My "Winners Holding Time Average" has actually dropped by a day. This holding time problem has really been bothering me the last couple of weeks thanks to my SMCI trade.
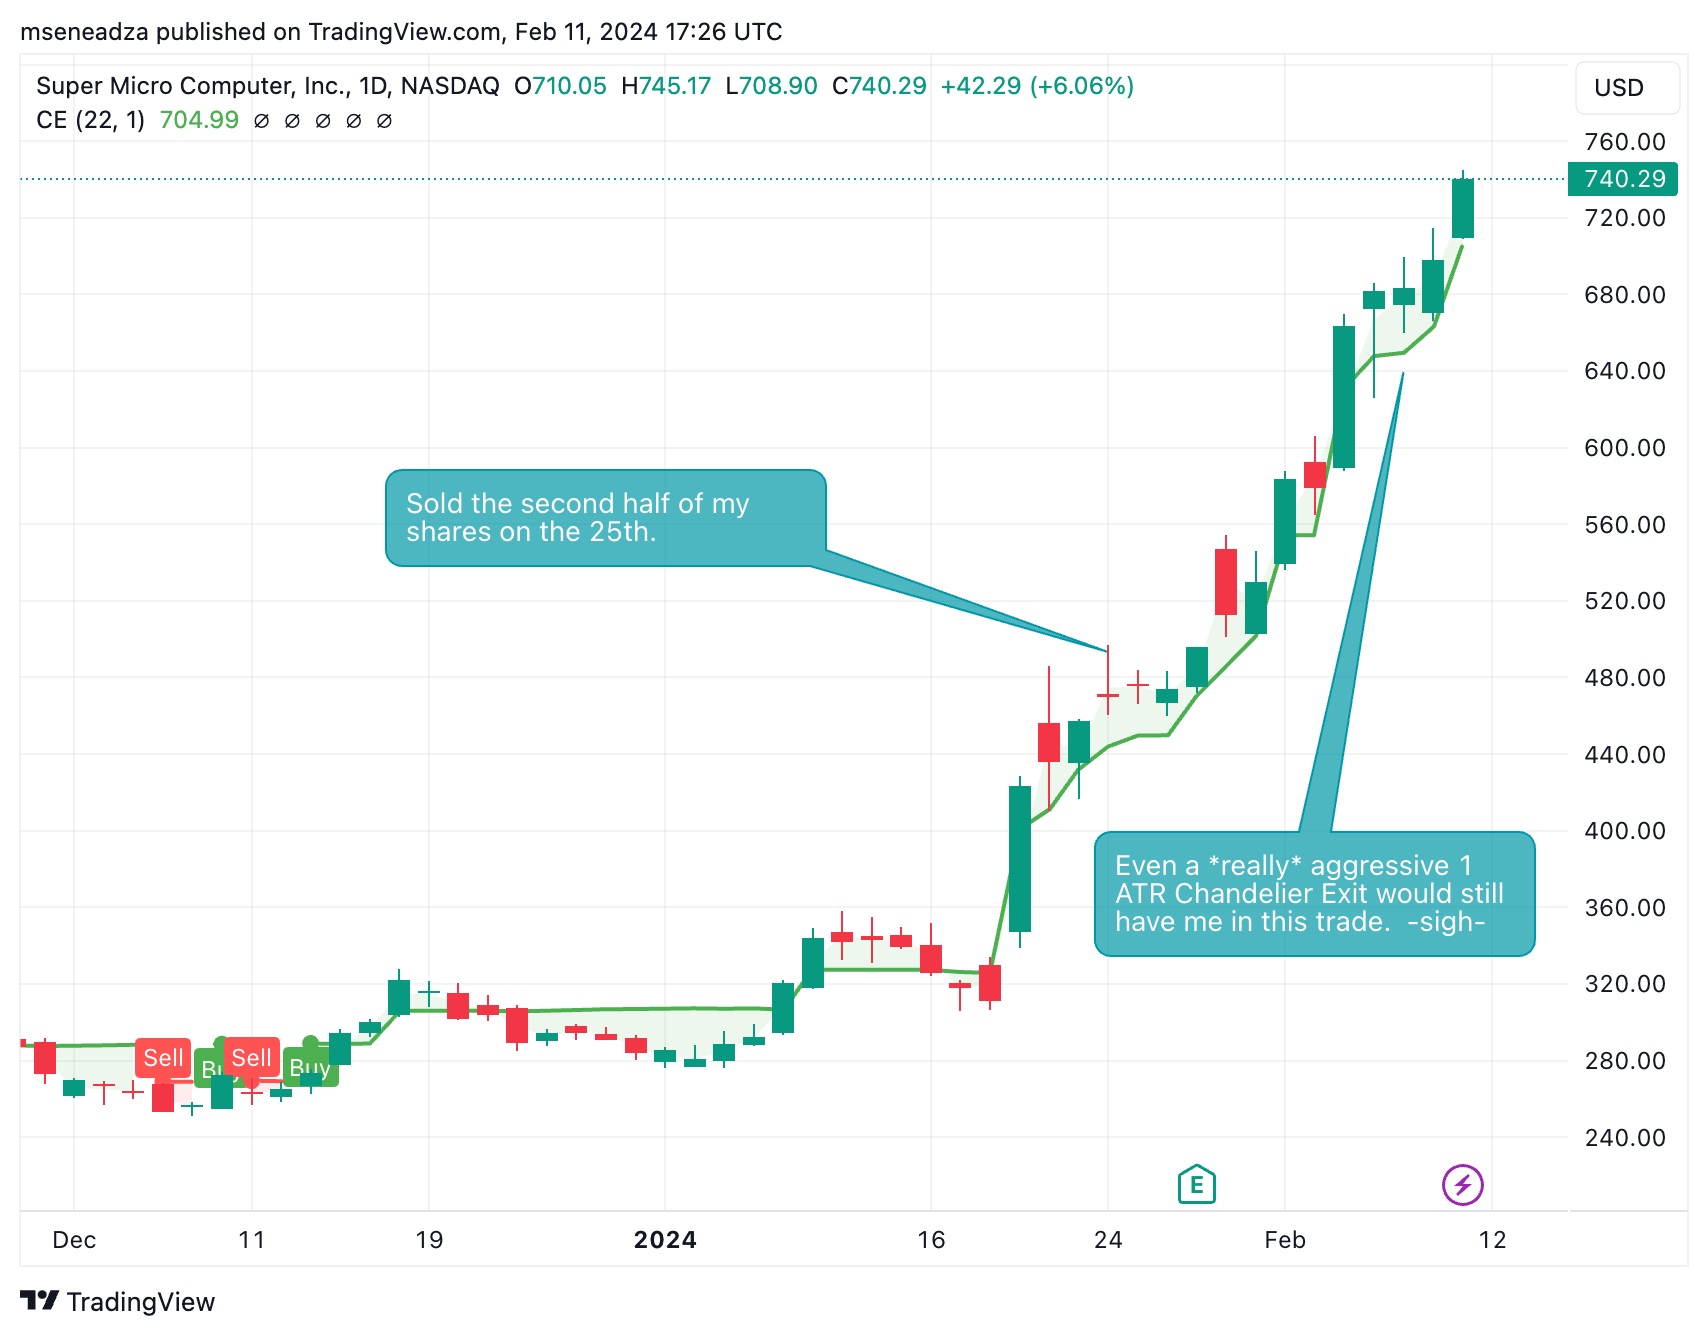
SMCI was my best R-Multiple trade of the year and #2 based on % gain. But it could have easily made me a lot more money if I'd just held on to it. As I wrote a couple of weeks ago, I took a quick partial profit by selling half my shares on the day of the big pop. I'm actually OK with that first sale but I could have managed the second lot much better. The reason I sold was I (wrongly) assumed that it just couldn't run much more. Silly me! SMCI has been a rocket ride (480 to 740!!!) & has been doing an upper Bollinger Band Walk since the day before sold it:
SMCI_2024-02-11_12-26-20.png235.8 KB
If I'd just used a simple Chandelier Exit to get me out I'd still be in the trade and I would have boosted my account by 14.4% instead of the 5.5% gain I locked in. That's an expensive lesson but it's one I won't soon forget. I'll definitely be using some kind of trailing stop on future movers like this.