New Addition: Stats on the Daily Scan Results
I recently added some data which may be helpful in getting a feel for what scans are "trending". I've started tracking the number of stocks which appear on each scan each day. That's enabled the ability to show how much above or below normal a scan is on any given day. You can find this data in two places.
Read More ➞New Scans/Alerts: New CLOSING 52-Week Highs and Lows
Over the last few weeks a few people have asked me if there is a way to differentiate new 52-week intraday highs from closing highs. The "new highs & lows" scans I've had on the site for years were simply alerting to intraday extremes. So I've decided to create a couple of new scans:
The original scans are still here but I've made these new signals/scans replace the old ones with regard to how the system treats them. For example, I used to count a stock making a new 52-week intraday high as a bullish signal. That always bothered me a bit because that same stock could have opened at a new high and sold off horrendously during the day. In a situation like that, the site would still be showing that new high as bullish. Well that won't happen anymore. I've changed the new intraday highs & lows to be neutral signals and the new ones will count as bullish or bearish. Hopefully you'll find these new ones useful.
Read More ➞Streamlined Adding of Stocks to Portfolios
I just made it a little easier to add stocks to portfolio lists in the app. Before you were required to enter the number of shares and the entry price. Those values are still required but they now get automatically set to default values (100 shares & the average price from the latest full trading day). So now you can just click the "Add to Portfolio" button without making any other adjustments.
This should come in handy for those who don't particularly want to track actual P&L within SwingTradeBot but, instead, want to track more stocks in order to get alerts/signals on them. This makes it easier to use a portfolio as an additional watchlist.
Read More ➞SwingTradeBot Expands to Seven More Global Stock Markets
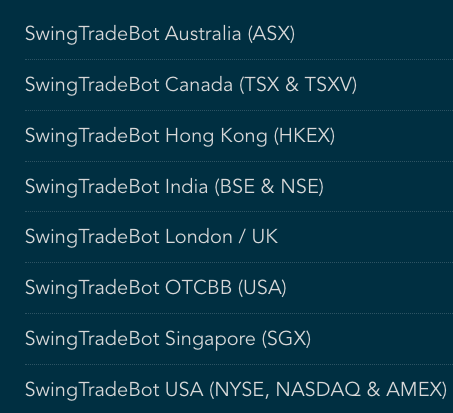
Shortly after SwingTradeBot went live (with coverage of US listed stocks -- NYSE, Nasdaq & AMEX) a few years ago people started asking me if I could add coverage of various foreign (to me) markets. My answer was always "yes, I just need a data source for those markets". I also needed to make some changes to the "engine" to make it a bit more generic and to be capable of hadling other markets.
Well I've been tweaking things over the last few months and I'm happy to announce the launch of seven more sites covering the following markets:
Read More ➞Customizing Your Stock Screening

I'm sharing an email exchange I had earlier today in hopes that it will help others to find ways to get exactly what they want when using the site to scan for stocks. A friend sent me this:
I was looking through your hammer scans on SwingTradeBot to see how Zillow stacked up on the grading curve. I was surprised Zillow (Z) only got a B. I looked at the A rated puppies and felt like Zillow (Z) should be higher rated. Then I realized what I really want is a modified hammer scan. I want hammers that come at the end of a period of selling, even better if it is an oversold hammer or a hammer coming off a high. The preceding selling has to be at least three straight down days. Did you already read my mind and create such a thing, or do I need to put a suggestion in the idea box? :)
Here's my answer:
Read More ➞Using the Bollinger Band Squeeze Scans
This will cover how to make use of all the Bollinger Band Squeeze-related scans, including:
- Bollinger Band Squeeze Stock Screen
- Bollinger Band Squeeze Started
- Bollinger Band Squeeze Ended
- Bollinger Band Squeeze + Lower Band Touch
- Bollinger Band Squeeze + Upper Band Touch
As you may be able to tell by the names, the last four scans are subsets of the first -- the plain old Bollinger Band Squeeze Scan. So those other four scans will have shorter lists of stocks. We'll see why you might want to use one of those scans instead of the primary BB Squeeze scan.
Read More ➞New Scans: MACD Crossovers!
Recently I've had several people ask me about MACD scans. Well I'm glad to announce that I've just added a few to alert/find MACD crossovers. They are:
Read More ➞Using the Down 3, 4 & 5 Days in a Row Scans
These three scans: Down 3, 4, or 5 Days in a Row, are pretty straight-forward. They do exactly what their names say -- find stocks which have closed lower multiple days in a row.
I like to use these scans to find strong stocks which are in long or intermediate-term uptrends which are experiencing pullbacks. I do that by sorting the results by Grade and then looking at those ranked highest -- A, B, or C. As in the GIF below, after sorting, I'll use the hover/pop-up charts to get a quick veiw of the chart. If it's one I want to explore further, I'll open it in a new browser tab and take a more detailed look after I've gotten through the entire list of scan results.

Combining with other scans
As with most technical analysis signals, they can be enhanced by combining them with other signals/scans or eyeballing the chart for pullbacks to some kind of support (old resistance level turning to support, a trendline or a previous low). So I often look for a confluence of at least two indicators in my trading candidates:
An issue that comes along in the world of pattern recognition is that one signal or trigger to a typical pattern may simply be noise and not an actual signal to an unfolding event. However, when signals begin to line up and you see multiple signals pointing to an outcome you can be more confident in an outcome. When multiple triggers begin to unfold, this is known as confluence and something that traders should look for, to have an edge before entering a trade.
A quick way to find some confluence is to use the Combo Scan. SInce I prefer trading pullbacks, these "Down 3, 4 or 5 Days in a Row" scans are some of my favorites to combine with other scans. Here are some ideas of other scans to combine them with:
- 50 DMA support
- 200 DMA Support
- Calm After Storm
- Doji Bullish
- Hammer Candlestick or Lizard Bullish
- Lower Bollinger Band Touch
- Multiple of 10 Bearish ( could be a bullish setup if the stock snaps back above that multiple of 10 -- or a bearish setup if it follows through)
- Multiple of 10 Bullish
- NR7
Reading Today's Technical Damage via the Scans Page and General Market Analysis Page
Back on February 8th I wrote about the negative divergence I noticed in one of my favorite indicators - the percent of stocks above their 50-day moving averages. If the market is having a healthy advance you should see a lot of stocks participating. That inidcator should be making higher highs along with the indices. The divergence in that indicator is a sign of a rally on poor breadth.
That divergence has been nagging at me since January but I've felt like I had to be a bull given the indices' stubborn advance. Well today it felt like the music stopped in a game of Musical Chairs and people were scrambling to sell. I thought last week's Fed decision to raise interest rates might have been the catalyst for a selloff but that didn't happen (and perhaps that was too obvious). Thankfully my nervousness had me keeping tight stops and I shorted some QQQ ahead of the Fed meeting. I was actually thinking about covering that short after this morning's gap up -- good thing I didn't!
I thought I'd follow up on that previous blog post by showing again how one can get a read on the market's health via some of the site's features. As I've mentioned, it's crucial to get a feel for the broad market's health & direction. I'm often asked which scan/signal is the best one -- but there's no one anser to that. Different things will work in different phases of the market. (I wrote a bit more on that topic in the FAQ) So I've put things on the site to help me do just that.
Read More ➞New Scan: Stocks Making a Cup-with-Handle Pattern
I'm releasing another new scan / signal today. This one finds stocks forming the handle portion of a cup-with-handle pattern. If you're not familiar with the cup & handle, here's a quick overview:
Read More ➞Recent Comments
- TRTCryptoCraig on Bad Quotes for 28 May...
- TraderMike on Bad Quotes for 28 May...
- TraderMike on Market Recap for Friday, May 31, 2024
- PleasantTurtle699 on Market Recap for Friday, May 31, 2024
- TraderMike on Market Recap for Friday, May 31, 2024
From the Blog
Blog Tags
Featured Articles